
from Товарищ Х
Socio-economic Inequality in India and the World since 1990
http://sanhati.com/excerpted/4338/
November 17, 2011
By Deepankar Basu
Abstract: Income or wealth inequality captures only a narrow slice of inequality in society. Non-income dimensions of inequality in health status and educational attainment are equally if not more important. The two dimensions, income and non-income, could be brought together to define a broader measure of socio-economic inequality. But unavailability of data on the distribution of health status and educational attainment across different sections of society make the construction of a direct measure of socio-economic inequality very difficult. This article proposes a simple and intuitive indirect measure. The indirect measure is used to rank the performance of 98 developing countries for the period 1990-2009. Countries which have aggressively embraced the neoliberal model display large increases in socio-economic inequality. Notable examples of such countries are: China, India, Kenya and Thailand. When compared with its neighbours (Bangladesh, Bhutan, Pakistan, Nepal and Sri Lanka), India emerges as the worst performer in South Asia.
Socio-economic inequality refers to a broad measure of inequality. It tries to capture societal inequality along both income (and wealth) and non-income dimensions. Why should we look at the broader measure of socio-economic inequality? This is because traditional measures that focus exclusively on income (or wealth) inequality capture only a narrow slice of socio-economic inequality since, by construction, they leave out non-income dimensions of well-being like mortality, incidence and burden of common diseases, nutrition, educational attainment and social status deriving from factors like caste, race or ethnicity.
While constructing direct measures of socio-economic inequality is a daunting task because of data problems, it is possible to come up with indirect measures of socio-economic inequality. Recent research that I have undertaken in this area has proposed an intuitive and simple-to-compute indirect measure for tracking changes in socio-economic inequality of over time by using the variation in life expectancy at birth (LEB) across countries [1]. Using this measure we see very vividly that countries which aggressively adopted neoliberal economic policies have witnessed sharp deterioration in socio-economic inequality since 1990. Notable examples of such countries are India, China, Kenya, Thailand, Ghana and Chad. This corroborates the concerns of the critics of neoliberalism who have pointed out, over and over again, that the growth process of the past few decades has been massively disequalizing.
Why indirect measures of socio-economic inequality?
There are at least three reasons that make this indirect measure useful for activists, researchers and policy makers. First, there is a big problem of unavailability of income distribution data for much of the developing world. For instance, between 1990 and 2009, income distribution data was available in the World Development Indicators (the most comprehensive on-line data base on the developing world maintained by the World Bank) between a maximum of 25 per cent of countries in 2000, and a minimum of 6 percent of the countries in 1990. Thus, even in the best case scenario, about 75 percent of developing countries do have income distribution data available.
Second, when data on income or consumption expenditure distribution is available for developing countries its quality is often low and they are beset with well-known problems. Changes in definitions or survey methodology often make comparability over time difficult [2]. It is also well understood that household surveys, the source of income distribution data, suffer from the problems of under-reporting and under-coverage of the richer sections of the population (Banerjee and Piketty, 2005). Even when reliable data on income distribution is obtained, it is not easy to convert that to measures of aggregate inequality like the Gini coefficient.
Third, data on the distribution of non-income measures of well-being are even more difficult to come by. But can we even come up with a simple measure of the distribution of the non-income aspects of well being across the population? Recent research suggests that we can. The idea is the following: while it is difficult to capture all non-income aspects of inequality in one simple measure, life expectancy at birth (LEB) has been proposed by social scientists as a broad social indicator of social well-being that captures many of the important dimensions of living standards that are left out by pure income measures. Ideally, one would like to track improvements in LEB across income classes to get an idea of the evolution of broad socio-economic inequality. Pandey and Nathwani (1997) use LEB data across broad income classes to construct a direct measure of socio-economic inequality; they demonstrate the use of their methodology using Canadian data. But data on LEB disaggregated by income classes is typically not available for most countries, especially poor countries. Hence, one needs to fall back on an indirect method to track changes in broad socio-economic inequality over time in poor countries.
How is the measure constructed?
The construction of the indirect measure of socio-economic inequality starts from the fairly intuitive idea that improvements in LEB (and possibly other indicators of living standard as well) over time for any country can be decomposed into three parts. The first part arises due to increases in per capita income over time, which allows families, on average, to eat better and more nutritious food, live in better houses with better sanitation facilities, purchase better and more effective medical care, etc.
The second part comes from improvements in, and diffusion of, medical technology. This is primarily driven by improvements in, and diffusion of, medical technology that reduce the impact of diseases on the general health of human populations. Improvements in pre and post natal care, access to hospitals (or medical professionals) for childbirth, and availability of generic drugs for dealing with common diseases like diarrhea, malaria, TB and AIDS can have an enormous positive impact on LEB.
The third part can be attributed to the whole complex sets of factors (institutions of governance, public policy stance, effectiveness of public provisioning, status of disadvantaged groups like women and other minorities, etc.) that distribute income growth and access to medical technology across various sections of society. What is the rationale for this assertion? It is the following intuitive idea: once income growth and improvements in medical technology (and other relevant exogenous factors like HIV prevalence) have been accounted for, improvements in LEB is bound to be positively impacted by redistribution towards the poor (broadly defined to include access to public goods like education, and health care) ; on the other hand, redistribution away from the poor, i.e. increase in societal inequality, would have negative impacts on improvements in living standards.
This immediately suggests a method for constructing an indirect measure of socio-economic inequality. To do so, roughly, we compute the average improvement in LEB for countries which have witnessed similar growth of per capita income and have had similar access to medical technology taking account of the fact that the relationship between LEB and per capita income is nonlinear (i.e., we allow for the fact that the marginal improvement in LEB for each unit of real per capita income increase tapers off as per capita income levels rise).
Next we divide the countries into two groups: those that performed better and those that performed worse than average. This division gives us some important information: all those countries which recorded a better-than-average improvement in LEB must have done so because of a progressive redistribution; all those countries which performed worse-than-average must have witnessed a regressive redistribution, where redistribution includes both income and non-income dimensions of well being.
Thus, we arrive at our indirect measure of socio-economic inequality: changes in how much a country under or over performed the average improvement in LEB over a period of time is a quantitative measure of the change in socio-economic inequality during that period. A positive value of the measure suggests a decrease and a negative value suggests an increase of socio-economic inequality over the relevant period.
Before we look at how countries have performed in terms of our indirect measure of socio-economic inequality, let us note an important implication of this methodology. The construction and use of the indirect measure proposed here highlights the important but oft-neglected point that as much as, or probably more than, economic growth itself the nature of that growth matters. High growth which is accompanied by worsening inequality (and reduced access of the poor to public goods) reduces the positive impact of income growth on living standards, especially of the poor. Conversely, even low economic growth that is more equitably distributed can have a significantly large impact on the material conditions of the poor. This means that the growth fetish currently gripping Indian policy circles is not only diversionary, it is patently misleading.
Country performances, 1990-2009
How do countries of the world perform in terms of changes in socio-economic inequality during the last two decades? Which countries show large declines and which show large increases in socio-economic inequality? Table 1 provides a raking of 98 countries from the developing world in terms of the decrease (or increase) of socio-economic inequalities between 1990 and 2009. Among the countries which display the largest declines in socio-economic inequality, according to my measure, are: Rwanda, Botswana, Gabon, Niger, Nepal, Guatemala, and Bangladesh. On the other end of the scale, some of the countries which displayed the largest increases in socio-economic inequality are: China, Republic of Congo, Chad, Thailand, India, and Kenya.
Two countries which have grown very rapidly since the 1990s but have not managed to translate that rapid economic growth into improvements in LEB are China and India. Both countries figure towards the very end of the list of rankings; India is ranked 88 and China 98 among 98 countries for whom the ranking was computed. This indicates that the growth process underway in both countries must have increased socio-economic inequality significantly.
It might be thought that the improvement metric is biased against countries that have registered high growth. This is not the case for two reasons. First, the comparison is made, at each point in time, between countries that have similar per capita income; hence all countries with similar levels of per capita income are treated in the same way. Second, as indicated above, the income-LEB relationship takes into account the inherent nonlinearity involved. Thus, the improvement metric already accounts for the fact that marginal increases in LEB calls for higher income growth as LEB increases.
The fact that the metric is not biased against high growth countries can also be seen from the rankings themselves (in Table 1). Countries with relatively high growth rates which also have shown rapid improvement in socio-economic inequality are: Bhutan, Bangladesh, Mozambique, and South Africa. This is in stark contrast to high growth countries with large increases in socio-economic inequality like China, India, and Thailand. On the other side, there are countries which had low growth in real per capita income and also witnessed increases in socio-economic inequality. Examples of such countries are Central African Republic, Kenya, and Zambia.
To highlight the fact that the metric is not biased against fast growing countries, let us look at the performance of some countries that grew at rates that were comparable to India's growth rate but also managed to improve socio-economic inequality. To choose this group I look at the growth rate of real per capita income between 1990 and 2009. During this period, real per capita income in India increased by 141%. With this benchmark growth rate in mind, I choose the following group of countries (the growth rate of per capita income between 1990 and 2009 is given in parentheses for each country): Argentina (76%), Bangladesh (89%), Bhutan (171%), Botswana (68%), Indonesia (83%), Malaysia (91%), Mozambique (101%), Peru (76%), Uganda (97%). In Figure 1 I plot a metric of over and under performance with respect to average levels of LEB given per capita income, HIV prevalence and medical technology over the period 1995-2009 for all these countries. By construction, all countries in Figure 1, other than India, display an increasing trend in the measure of over/under performance. Since these countries grew at rates that were comparable to the growth rate for India, it must be the case that the metric is not overly biased against fast growing countries.
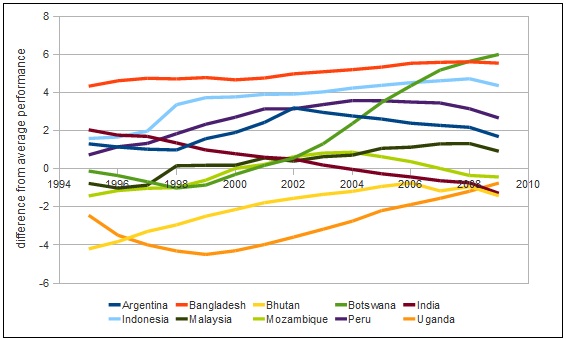
Figure 1: Time series plots of the a metric of over and/or under performance with respect to average LEB across the world given income, HIV prevalence and medical technology for countries which grew at comparable rates to India between 1990 and 2009. Trends in the metric provide information about the direction of change in socio-economic inequality, an increasing (positive) trend indicating reductions in socio-economic inequality and vice versa.
India is the worst performer in South Asia
How does India compare with its neighbours? Figure 2 plots the same metric of over and under performance (as occurs in Figure 1) over the period 1990-2009 for the main South Asian countries: Bangladesh, India, Nepal, Pakistan and Sri Lanka. A positive value of the metric for any year denotes better-than-average performance; a negative value indicates worse-than-average performance. More important than the value of the metric in any year is the trend. An increasing trend indicates steadily improving socio-economic inequality; a declining trend points towards a steady worsening of socio-economic inequalities.

Figure 2: Time series plots of the a metric of over and/or under performance with respect to average LEB across the world given income, HIV prevalence and medical technology for the main South Asian countries (BGD: Bangladesh; BTN: Bhutan; IND: India; NPL: Nepal; PAK: Pakistan; LKA: Sri Lanka). Trends in the metric provide information about the direction of change in socio-economic inequality, an increasing (positive) trend indicating reductions in socio-economic inequality and vice versa.
What does Figure 2 highlight? It highlights the striking differences in the evolution of socio-economic inequalities (as measured by the trend in the metric) for the main South Asian countries. While Nepal and Bangladesh give strong evidence of improvement in socio-economic inequality and access of the poor to basic public goods, Pakistan shows stagnation and Sri Lanka shows worsening over this period though it remains an above-average performer. Bhutan has been a below-average performer all through the period, though its distance from average performance has been declining over time; that indicates some improvement over time.
The big exception is India which shows not only a steady worsening of socio-economic inequality but a switch from an above to a below average performer country. A more detailed historical and institutional analysis of each of these South Asian countries needs to be taken up to understand the reasons behind this divergence. While such an analysis will be taken up in future research, it seems safe to conclude from this evidence in Figure 1 that the effects of rapid economic growth since the 1990s has not percolated down to the poorer sections of Indian society. In fact, it seems to have worsened socio-economic inequality and curtailed access of the poor to essential public goods like health care and education.
Conclusion
Critics of the neoliberal turn to policymaking in India, and the world in general, since the mid-1980s have pointed out that the growth process under a neoliberal regime is inherently anti-poor. Most of the dividends of economic growth is cornered by the already well off. In parallel with an inegalitarian growth process, neoliberalism also whittles down whatever welfare State measures might have been in place before its adoption. Inegalitarian growth and erosion of State assisted welfare provisioning increases socio-economic inequality drastically. Drawing on some recent research, this article has provided empirical evidence in support of such a view.
Two comparison groups provide a powerful and disturbing insight into India's growth process. First, there are many countries which have grown at rates very similar to India's but which have managed to register marked declines in socio-economic inequalities (as captured by the measure discussed in this article). In stark contrast to this, India has witnessed an increase in socio-economic inequality since 1990. Second, in comparison to its close neighbours, with whom India has many geographical, climactic, cultural and social commonalities, India emerges as the worst performer among the South Asian countries.
The implications of this finding are straightforward. The growth process currently underway in India (and China) is inherently biased against the poor, the marginalized and underprivileged. If economic growth is to lead to substantial improvements in the living standards (measured by indicators of well being like life expectancy, literacy, infant mortality) of the vast majority of the world's population, a radically different socio-economic paradigm must be put in place of the currently dominant neoliberal one.
(I would like to thank Debarshi Das and Sirisha Naidu for helpful comments on this article and the original paper on which this article is based. The research underlying this article was spurred by deep and penetrating questions from TVS Prathamesh, Shiv Sethi and Kuver Sinha.)
Notes
1. http://www.peri.umass.edu/fileadmin/pdf/working_papers/working_papers_251-300/WP268.pdf
2. For an introduction to these data issues in the context of India, see Deaton and Kozel (2005).
REFERENCES
Banerjee, A., and T. Piketty. 2005. "Top Indian Incomes, 1922-2000," The World Bank Economic Review, 19 (1): 1-20.
Deaton, A., and V. Kozel. 2005. The Great Indian Poverty Debate. Macmillan India Ltd.: Delhi.
Pandey, M.D., and S. Nathwani. 1997. "Measurement of Socio-Economic Inequality using the Life-Quality Index," Social Indicators Research, 39: 187-202.
No comments:
Post a Comment
Comments